Let the Browser Do the Math or: How I Learned to Stop Worrying and Love the DOM
Table of Contents
As I’ve been working on My Mind is Racing, I’ve been trying to make the pages look nicer when they are shared. That means adding an og:image meta property:
<meta property="og:image" content="https://mymindisracing.com/social-cards/world.png">
#Doing it the hard way first
The Open Graph (og) metadata gives you more control over how a page preview renders on Reddit, LinkedIn, [insert name of social media walled garden]. Of course adding the metadata also means producing an appropriate image. This is my top level og:image:
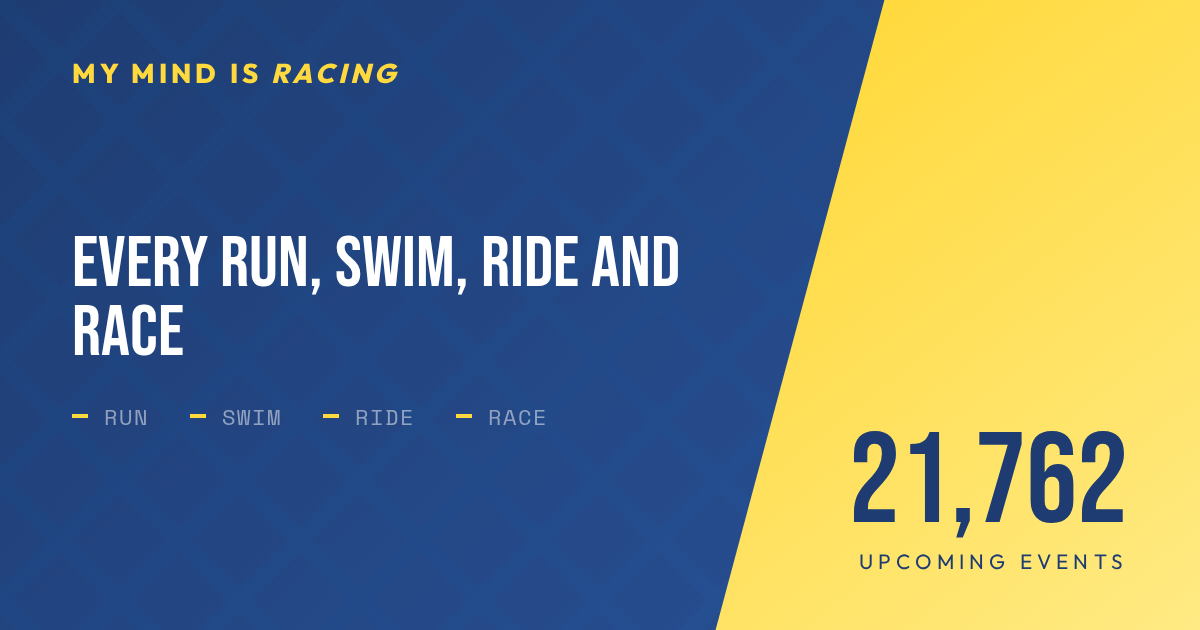
That’s nice, but it might be a bit weird to show this card for a small town with one or two events. Since I have lots of data to work with, I thought it would be fun to create different cards. I would customize the card display based on the country, region and city of the page being shared. This meant getting a nice design and then rendering all of the cards with a Golang library. This was fine, but it got a bit fiddly when I had to do things like use a specific font or calculate how large the font needed to be and how the text should be positioned when a place name, for example, was longer than I had been expecting.

You can totally solve this problem with math, but I don’t want to. HTML is really good at reflowing text, repositioning one thing when another thing moves, adding a bit of padding here and there. You see where I’m going with this? Instead of using more complicated math, I opted for a more complicated workflow and on a very high level it looks like this:
#The workflow
flowchart TD
    Data["Your params<br/>city, region, events"] -->|"as a query string"| Get["GET the template page<br/>/template?city=Toronto#amp;region=Ontario#amp;events=28"]
    Get --> Render["Headless browser loads the HTML;<br/>JS reads the params, CSS lays out the card"]
    Render --> Shot["Screenshot the #card element"]
    Shot --> PNG["PNG image"]
Easy, right? That workflow essentially produces this image for Toronto:

#Render it with a headless browser
It turns out that once you have Playwright available, the screenshotting is pretty simple.
// render-card.js — template URL in, PNG out (Playwright)
const { chromium } = require("playwright");

const params = new URLSearchParams({
  title: "Lost Swimming Open Water Group Swim",
  subtitle: "Oakville · Ontario",
});
const url = `http://localhost:3000/template?${params}`;

const browser = await chromium.launch();
const page = await browser.newPage({ deviceScaleFactor: 2 });
await page.goto(url, { waitUntil: "networkidle" });
await page.evaluate(() => document.fonts.ready); // don't shoot mid-font-swap
await page.locator("#card").screenshot({ path: "card.png" });
await browser.close();
#A card for every athlete
It gets a little more complicated than this when you want to do it at scale, but the basic idea is the same. Now that I have cards for locations, how about adding cards for events? Swimmers should get their own theme.
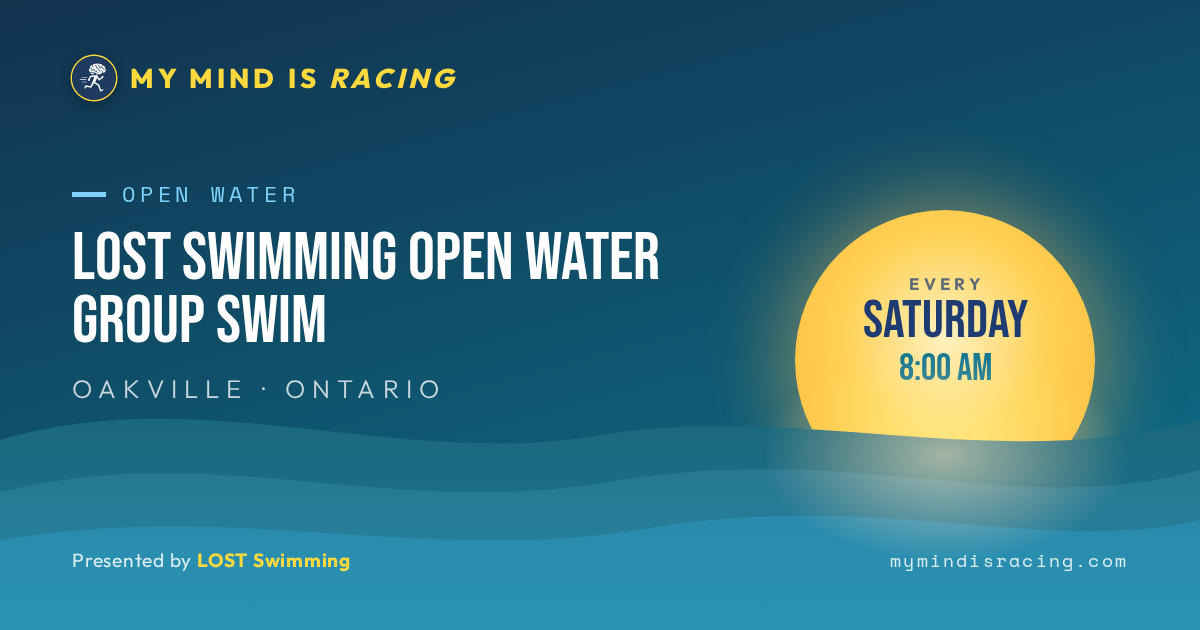
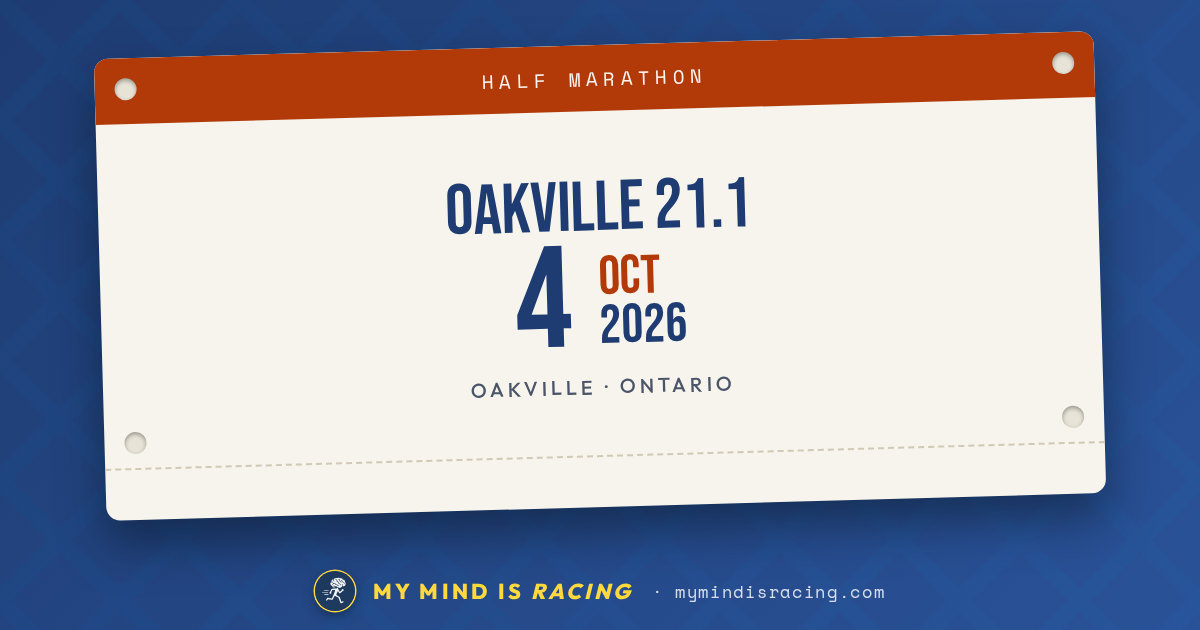
Obviously runners want a bib:
#Keeping it real
Now that we have images, we can embed them in the appropriate pages. We can add height and width properties and we can also add a cache-busting param to the image, should we decide that the yellow ring around the running brain logo reminds us too much of the Buffalo Sabres.
<meta property="og:image" content="https://example.com/social-cards/….png?v=1785054788" />
<meta property="og:image:width" content="1200" />
<meta property="og:image:height" content="630" />
I could really drill down on this, but I’m not going to bore you with the details. I really enjoyed solving this problem. In fact, I’m still chipping away at parts of it as I scale it up. I can take on the same kind of gnarly (or worse) problems for you — so if you’ve got problems, get in touch.